"Imagination
is the fountain of possibility."
-- Christina Nikolov

Knocking Their Lights Out
by
Christina Nikolov, Founder / CEO ChartWatchCentral
Name/Ticker: Cymer Inc. (CYMI)
Date: January 2, 2003
Opinion: Bearish
Current Price: $34.58
Target Price(s): $29.17, $26.22, $25.27 and $16.31
Commentary:
Over the past three months, Wall
Street's prognosticators bulldozed their 2003 earnings estimates for Cymer Inc.
(CYMI) by 59.6%. Regardless, the shares are now 72.8% higher than they were
three months ago and tout a p/e multiple of 81 based on fiscal 2003 projections.
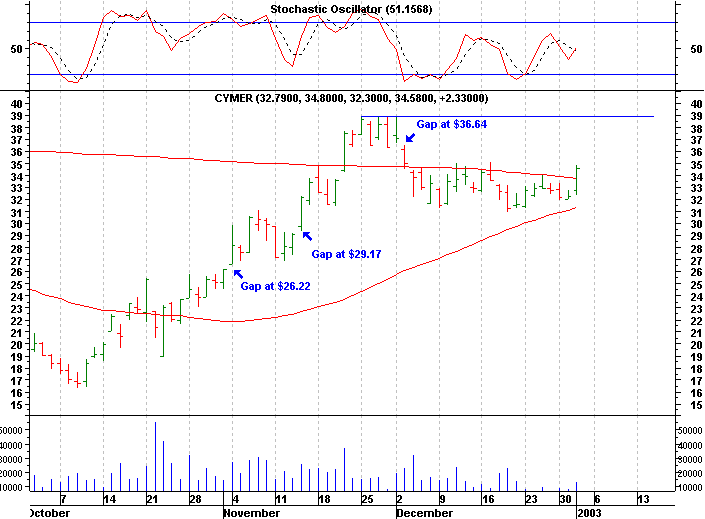
Cymer's shares rocketed ahead by 138% between the October 9th low and
the December 2nd peak, then quickly surrendered about 35% of that gain. That
drop pushed the stock back to fairly significant support near $30. (chart
#1)
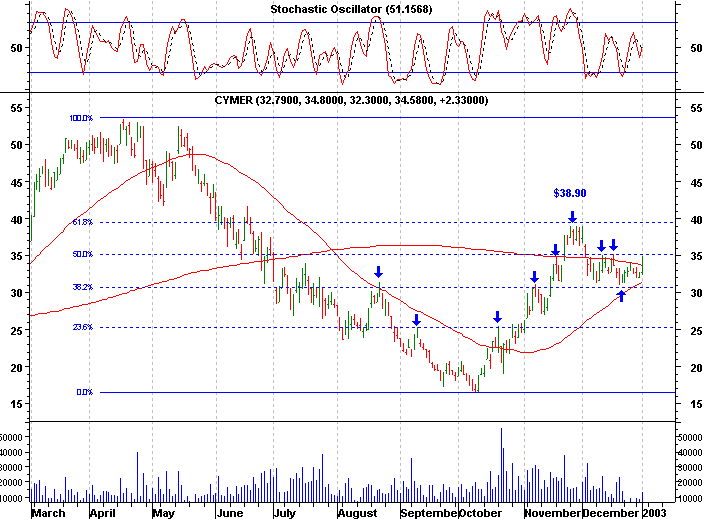
When we applied Fibonacci Retracement to CYMI's price action, we
found it very accurately predicted almost every reversal over the past five
months. The combined effect of November's peak ($38.91), a downside gap ($36.64)
and the 61.8% Fibonacci Level ($39.60) will cause the shares to stall as they
approach $40. (chart #2)
Eventually, there is a good chance CYMI will
fill upside gaps at $26.22 and $25.27.
To profit from the anticipated
decline, we suggest the August 40 put (Symbol: CQGTH), which is currently
offered at $9.80. If the stock challenges $40, you might be able to purchase
this option for around $8.
Chart(s):
#1) Cymer Inc. (CYMI) Three Month Daily Chart
|
Click the Chart for an Enlarged View
#2) Cymer Inc. (CYMI) Ten Month Daily Chart
|
Click the Chart for an Enlarged View
|
|

[ Back ]