|
[ Home Page ] |
[ Back ] |
[ Close Window ] |
ChartWatchCentral Premium Stock Picks
Food
For Thought
by
Christina Nikolov
Founder/CEO,
ChartWatchCentral, Inc.
Date: May 09, 2008
Company: Whole Foods Market
Ticker: WFMI
Price: $32.78
Opinion: Bullish
Comments:
Whole Foods Market (WFMI), one of the fastest growing public
retail food chains in the U.S., is currently trading at a steep
discount to where it has been and probably should be trading. Here's
why? First, the stock touts price-to-book, price-to-earnings and
price-to-sales multiples of 3.2, 28.3 and 0.65, compared with the
loftier respective figures of 48.8, 10.3 and 2.3 boasted by the
Retail (Grocery) Industry. Not to mention, quarter over quarter
sales growth, as well as the five-year growth rate of earnings and
sales for WFMI, all of which exceed the average figures reported
for their peer group.
While we believe WFMI is an exceptional value at this level, the rebound might take some time to materialize, since the company incurred a significant increase in expenses related to its expansion plans. Eventually, their investment which includes the acquisition of Wild Oats, should boost revenues and earnings significantly.
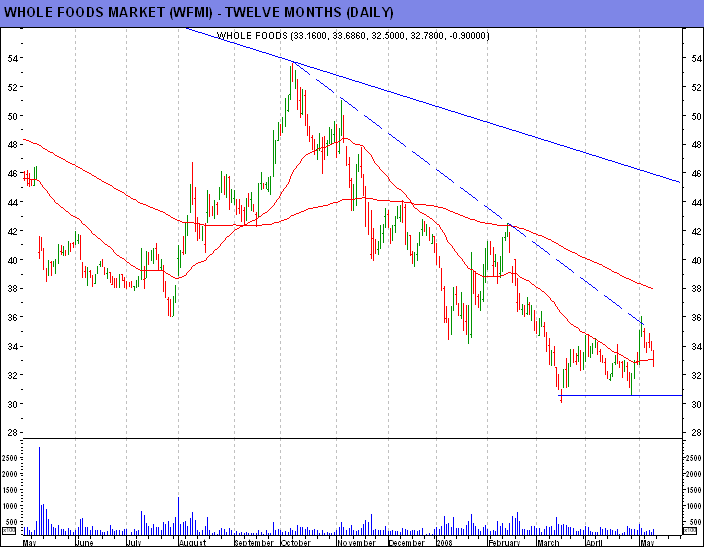
Despite the above-mentioned growth and excellent prospects, WFMI is trading almost 60% below its all-time high of $79.90, which is exactly where it was four and one-half years ago. Since October, the shares have fallen steadily, bumping their head against a downtrend line (overhead resistance) along the way, with one test coming last November, another this February and most recently last week. In the process of the last week's surge, the shares sliced above the 50-day weighted moving average on volume 60% above the typical daily turnover, but was capped at 'double-barreled' overhead resistance near $36. Why is it called 'double-barreled'? First of all, the downtrend line mentioned earlier was just below $36 when encountered, acted as resistance. And the share price staged two significant rallies off the $36 level (August 2004 and July 2007) both times it confronted it on the downside.
|
Fundamental Snapshot |
Whole Foods Market (WFMI) |
Retail (Grocery) Industry |
|
Current P/E Multiple1 |
28.30 |
48.81 |
|
Price to Book2 |
3.21 |
10.27 |
|
Price to Sales1 |
0.65 |
2.27 |
|
12-month Sales Growth (%) |
31.35 |
6.80 |
|
Sales - 5 Year Growth Rate3 |
19.63 |
7.58 |
|
EPS - 5 Year Growth Rate3 |
13.69 |
12.33 |
|
Dividend Yield |
2.35 |
1.13 |
|
Revenue/Employee1 |
159,873 |
347,862 |
1) Trailing 12-months. 2) Most Recent Quarter. 3) Annualized. (All data provided by Reuters.com)
To profit from this opportunity, we suggest initiating a long position at the current level. Or if you want a little more bang for your buck, you might wish to purchase the January 2009 $25 call (ticker: .OAWAE), last offered at $9.30. Since we believe there is strong support at the March and April lows, near $30.00, if that level is decisively penetrated on the downside, you might consider exiting your position. Meanwhile, there is no shortage of overhead resistance, with some of the more critical levels residing at $34, $36, $40, $42, $47 and $52. And that doesn't even factor in a second downtrend line (currently at $45.85) linking the three major peaks which occurred in May 2006, October 2006 and October 2007.
Note: Symbols of LEAP options change regularly, so please be
sure you are trading the correct security.
Disclaimer
- The investor is aware and agrees that if they choose to invest in any recommendation
posted on ChartWatchCentral's website, they are doing so totally at their own
risk. ChartWatchCentral will not be held liable for any losses or negative
impacts which might result from investing in these picks.

|
[ Home Page ] |
[ Back ] |
[ Close Window ] |
