ChartWatchCentral Stock Picks

One In A Million
byChristina Nikolov
Founder/CEO, ChartWatchCentral, Inc.
Date: May 16, 2009
Company: Books-A-Million
Ticker: BAMM
Price: $7.81
Opinion: Bullish
Comments:
Books-A-Million (BAMM) shares lost more than half their value
over the past year and closer to two-thirds of their market capitalization
when looking back
18-months. We don't believe this tremendous decline is warranted
for many reasons. First, net sales increased 2.8% to $535.1 million
in fiscal year 2008, from $520.4 million in fiscal-year 2007, while
net income declined to $16.5 million, or $1.01 per diluted share
from $18.9 million, or $1.12 per diluted share.earnings during the
same period.
The fiscal-year 2008 sales and income performance can be attributed to two things: First, 2007's figures were based on 53 weeks, while 2008 only had 52 weeks. That extra week at the end of 2007's fourth quarter and full-fiscal-year accounted for an additional $9.0 million in net sales. In addition, due to the recognition of gift card breakage (unredeemed aged gift cards included as revenue) from prior years, the company produced one-time additional sales income of $2.2 million, which is $1.5 million net of taxes.
Meanwhile, BAMM touts price-to-book, price-to-earnings and price-to-sales multiples of 1.23, 7.55 and 0.23, compared with respective figures of 7.09, 43.31 and 1.97 for the Retail (Specialty) Industry and 4.01, 19.51 and 2.67 for the S&P500 Stock Index. And if that isn't good enough, BAMM's five-year earnings per share growth rate is 39.3%, versus an average of 24.01% for its peer group and 24.22% for the S&P500.
Even better, the company pays a 4.61% dividend and has only 15.81 million shares outstanding as of the most recent annual report. While the float is approximately 5.95 million shares, we estimate that approximately 600,000 shares are really in play on a daily basis, since 8.1 million (51.22%) are held by insiders and 7.1 million (44.90%) are held by institutions. Since more than one million shares were calculated as "shorted" as of April 25th, any rebound could be a sharp one, since very few shares will likely be available to satisly the demand for short-covering alone.
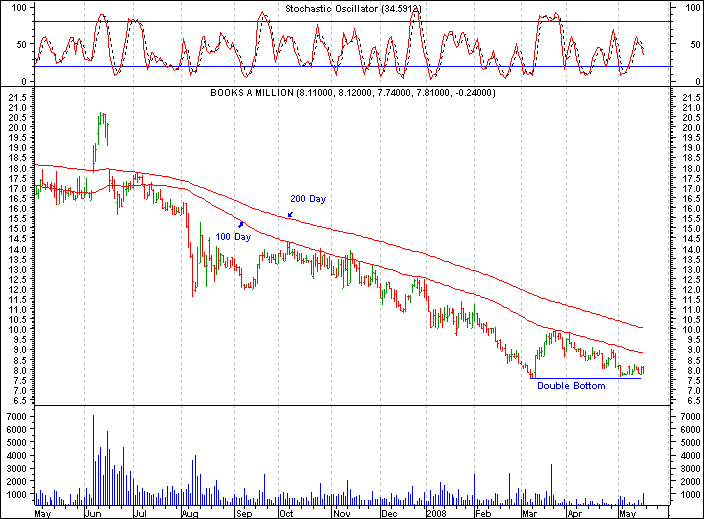
Since March, BAMM has been trading in a range between $7.50 and
$10.00, tracing out what appears to be a double bottom. And considering
that the 100-day weighted moving average (currently perched at $8.78)
has capped at least six rally attempts over the past year, a close
above that level could be extremely bullish. Taking the fundamental
and technical pictures into consideration, we believe BAMM is considerably
undervalued and could surge (at least 50%) to $12 over the next
six months. There should be strong support near the March low (approx.
$7.50), so you might wish to place a protective stop somwhere below
that level.
|
Fundamental Snapshot |
Books-A-Million (BAMM) |
Retail (Specialty) Industry |
|
Current P/E Multiple1 |
7.55 |
43.31 |
|
Price to Book2 |
1.23 |
7.09 |
|
Price to Sales1 |
0.23 |
1.97 |
|
Sales Growth (%)2 |
-3.62 |
14.06 |
|
Sales - 5 Year Growth Rate3 |
4.17 |
20.69 |
|
EPS - 5 Year Growth Rate3 |
39.30 |
24.01 |
|
Dividend Yield |
4.61 |
1.53 |
|
LT Debt/Equity2 |
0.07 |
0.53 |
1) Trailing 12-months. 2) Most Recent Quarter. 3) Annualized. (All data provided by Reuters.com)
Note: Placing a protective stop order too close to the bottom
of the base could result in being stopped out of your position.
during a quick shakeout. We suggest using a figure of at least 3-5%
below the lows as a starting point. What you use will depend on
your risk tolerance.

|
[ Home Page ] |
[ Back ] |
[ Close Window ] |