ChartWatchCentral Premium Stock Picks

Ripe For A Decline?
by
Christina Nikolov
Founder/CEO,
ChartWatchCentral, Inc.
Date: July 19, 2010
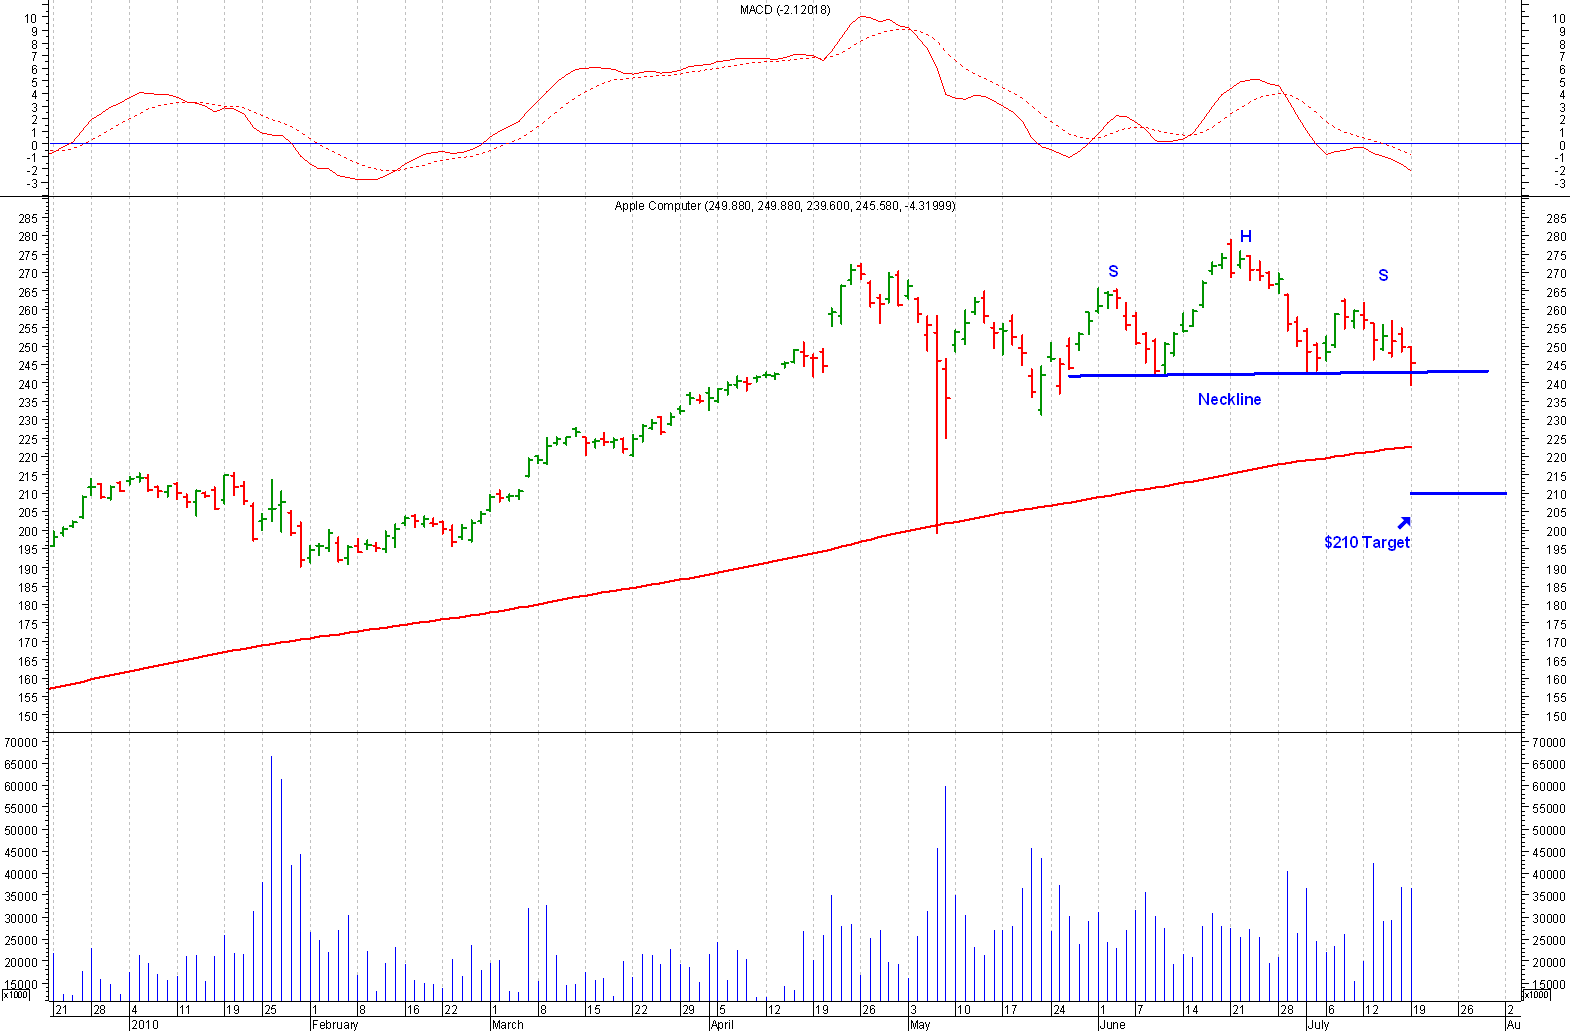
Company: Apple Computer.
Ticker: AAPL
Price: $245.59
Opinion: Bearish
Comments: It's
difficult to find anything wrong with Apple Computer (AAPL).
As the included data indicates, the company touts Growth Rates,
Price Ratios, Profit Margins, Investment Returns and an overall
Financial Condition which exceeds its typical peer within the Computer
Hardware Industry. See the tables below for specific details.
Since price action on stock charts is often used to look ahead at what could or will occur in the future, rather than to look back what has taken place, it is our belief that one of a few things could be transpiring at this juncture. Either the Fundamentals are about to change, or the chart is wrong. We believe the answer resides behind door number three. The fundamentals are intact, but the stock got a little bit ahead of itself and needs to do some "backing and filling" for a while, before continuing higher. If our downside target of $210 is achieved (and that is a big 'IF', considering the strong fundamentals), that would be a nearly one-third retracement of the January 2009 to June 2010 rally from $78 to $279 - a very healthy pullback during a strong bull move.
To profit from a potential pullback to $210, we suggest entering a January 2011 $270/$210 put spread at a $28.65 debit. The $270 put is offered for $43.30 and the bid on the $210 put is $14.65. The way this trade works is you would purchase the higher strike put and sell short the lower price strike, in effect lowering your entry price, while also increasing your breakeven point from $226.70 to $241.35. The only downside is that if the shares do decline and do so in a big way, your gains would be capped at a 109% return, since you won't make any more money as the shares descend below $210.
Due to the very positive fundamentals, we do expect any pullback (if it occurs) to be short-term in nature. Keep an eye on the recent peaks near $265, because if that resistance level is violated, this bearish reversal pattern would be negated.
|
Growth Rates % |
Company |
Industry |
|---|---|---|
|
Sales (Qtr vs year ago qtr) |
48.60 |
45.80 |
|
Net Income (YTD vs YTD) |
66.50 |
61.60 |
|
Net Income (Qtr vs year ago qtr) |
89.80 |
82.50 |
|
Sales (5-Year Annual Avg.) |
38.97 |
35.18 |
|
Net Income (5-Year Annual Avg.) |
98.68 |
87.30 |
|
Price Ratios |
Company |
Industry |
S&P 500 |
|---|---|---|---|
|
Current P/E Ratio |
21.2 |
20.8 |
22.0 |
|
Price/Sales Ratio |
4.45 |
4.05 |
1.98 |
|
Price/Book Value |
5.78 |
5.64 |
3.18 |
|
Price/Cash Flow Ratio |
19.60 |
18.70 |
13.70 |
|
Profit Margins % |
Company |
Industry |
|---|---|---|
|
Gross Margin |
41.3 |
38.9 |
|
Pre-Tax Margin |
29.8 |
27.1 |
|
Net Profit Margin |
21.2 |
19.3 |
|
5Yr Gross Margin (5-Year Avg.) |
34.9 |
33.2 |
|
5Yr PreTax Margin (5-Year Avg.) |
22.2 |
20.6 |
|
5Yr Net Profit Margin (5-Year Avg.) |
15.3 |
14.2 |
|
Investment Returns % |
Company |
Industry |
S&P 500 |
|---|---|---|---|
|
Return On Equity |
34.0 |
33.5 |
22.1 |
|
Return On Assets |
21.6 |
19.9 |
7.6 |
|
Return On Capital |
29.1 |
27.3 |
10.2 |
|
Return On Equity (5-Year Avg.) |
29.2 |
32.1 |
16.5 |
|
Return On Assets (5-Year Avg.) |
17.9 |
17.1 |
7.6 |
|
Return On Capital (5-Year Avg.) |
26.3 |
26.4 |
10.3 |
|
Financial Condition |
Company |
Industry |
S&P 500 |
|---|---|---|---|
|
Debt/Equity Ratio |
0.00 |
0.08 |
1.12 |
|
Current Ratio |
2.6 |
2.5 |
1.4 |
|
Quick Ratio |
2.6 |
2.5 |
1.1 |
|
Interest Coverage |
NA |
1.0 |
27.6 |
|
Leverage Ratio |
1.5 |
1.9 |
3.7 |
|
Book Value/Share |
43.26 |
39.19 |
22.67 |

|
[ Home Page ] |
[ Back ] |
[ Close Window ] |